



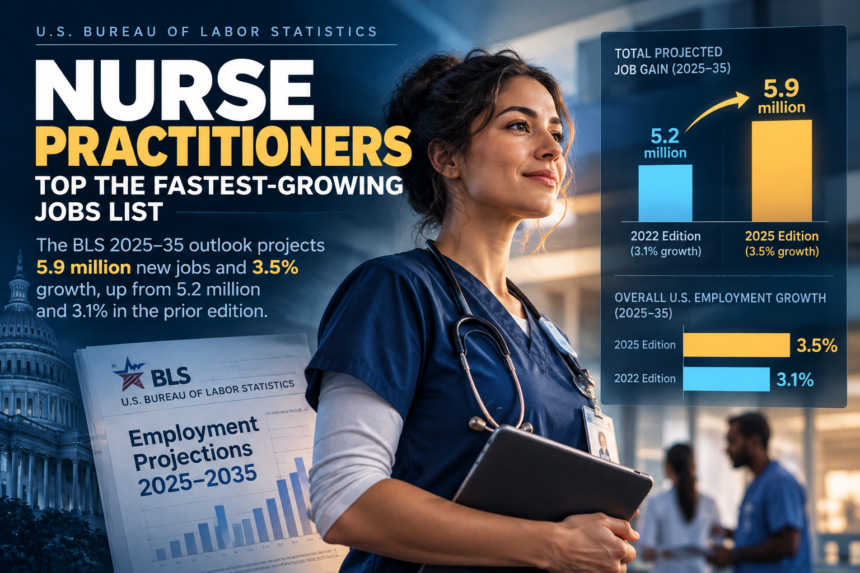
The US Bureau of Labor Statistics (BLS) lists nurse practitioners as the fastest growing occupation in its 2025–35 employment projections, at +41.0%1, 2. Solar photovoltaic installers (+36.5%), data scientists (+34.6%) and wind turbine service technicians (+29.5%) follow1, 2. In the 2024–34 edition, wind technicians and solar installers led and data scientists ranked fourth, so the top of the list changed2, 3.
The exceptions are the growth rates recorded over past decades1, 2, 3 and the 2025 employment and wage figures1, 2, which BLS reports as measured. They come from a single source, bls.gov, and we have not independently confirmed them. We could not retrieve the 2024–34 percentages for individual occupations, so occupation-level comparisons are limited to rank2, 3.
The overall picture
BLS’s 2025–35 release, published 27 August 2026, projects US employment rising from 170.3 million to 176.2 million1, 2. That is 5.9 million jobs, or 3.5%, slower than the 10.9% growth recorded over 2015–251, 2.
The prior edition, released 28 August 2025, projected 5.2 million jobs and 3.1% growth, against 13.0% recorded over 2014–242, 3. The new edition therefore projects a larger gain (5.9 million jobs against 5.2 million) and a slightly higher rate (3.5% against 3.1%)2, 3. The two use different base years, so the comparison is indicative only2, 3.
| Measure | Prior edition | New edition | BLS stated driver | Source |
|---|---|---|---|---|
| Total US job gain | +5.2 million (3.1%) | +5.9 million (3.5%) | Not stated in claim | 1, 2, 3 |
| Fastest growing occupations | Wind turbine service technicians and solar photovoltaic installers named fastest; data scientists fourth | Nurse practitioners first (+41.0%), solar installers second, data scientists third (+34.6%), wind technicians fourth (+29.5%) | Solar and wind: electricity demand | 1, 2, 3 |
| Solar and wind jobs added, combined | Fewer than 20,000 | Fewer than 15,000 (solar +11.3k, wind +3.5k) | Electricity demand | 2, 3 |
| Fastest growing industries | Four fastest, all energy generation: 41,600 jobs combined | Electricity demand drives 4 of the 10 fastest; computing infrastructure and data processing +25.1% (+120,400 jobs); utilities +9.8% (+58,800) | Electricity demand from AI adoption and data centers (prior edition also cited EVs) | 2, 3 |
| Computer and mathematical group | +10.1%, second fastest | +7.3%, fifth fastest | AI development; AI supports demand for data scientists and research scientists | 2, 3 |
| Office and administrative support | AI and automation cited for decline; no percentage in release text | -4.0% (752,100 jobs, most of any major group) | AI and automation | 2, 3 |
| Healthcare support / practitioners and technical | +12.4% / +7.2% | +13.3% / +8.0% | Ageing population, chronic conditions | 1, 2, 3 |
| AI exposure categories | Not part of the prior edition per claim wording (new) | Low to Very high for 831 occupations; BLS says not a forecast or replacement estimate | Five external sources, including Anthropic Claude and Microsoft Copilot usage data | 2, 4 |
The fastest growing occupations
Nurse practitioners are projected to grow from 336.3 thousand to 474.1 thousand jobs, with a median wage of $132,3001, 2. Data scientists are projected to add 95.4 thousand jobs1, 2. Also listed are computer and information research scientists (+21.8%), information security analysts (+21.0%) and medical and health services managers (+24.2%)1, 2.
Percentages can mislead at the top of a ranking, because small occupations grow fast from a small base. Solar installers and wind technicians show this. BLS ties their growth to electricity demand. For 2025–35 the two are projected to add fewer than 15,000 jobs combined, down from fewer than 20,000 in the 2024–34 edition2, 3. Table 1.3 shows solar installers at +11.3 thousand and wind technicians at +3.5 thousand2, 3.
Where BLS cites electricity demand
BLS says electricity demand, due in large part to AI adoption and data centres, is expected to drive projected growth in 4 of the 10 fastest growing detailed industries in 2025–352. One is computing infrastructure providers, data processing, web hosting and related services, projected to grow 25.1% and add 120,400 jobs2. Utilities is projected to grow 9.8% but add only 58,800 jobs2.
The earlier edition made a similar argument. It attributed rising electricity demand to AI integration, electric vehicles and new data centres. It projected the four fastest growing industries, all in energy generation, to add 41,600 jobs combined3.
The driver is largely the same in both editions, though the earlier one also names electric vehicles2, 3. What changed is where the growth appears: the 2025–35 release lists computing infrastructure, data processing and web hosting among the fastest growing industries, at a projected 25.1%2. The earlier edition’s industry passage names only energy generation3.
Where BLS cites AI
BLS says AI is expected to support demand for data scientists and for computer and information research scientists in 2025–352, 3. It projects computer and mathematical occupations, the wider group, at +7.3%, fifth fastest of the major groups2, 3. In 2024–34 the group was projected at +10.1%, second fastest, and that edition also attributed it to AI development2, 3. The figures come from different editions and may not be strictly comparable2, 3.
BLS also names AI-linked declines. It projects office and administrative support to fall 4.0%, a loss of 752,100 jobs, the most of any major group2, 3. It puts sales and related occupations at -1.4% and production at -0.4%2, 3. BLS says generative AI may limit demand in arts, design, entertainment, sports and media2, 3.
The 2024–34 release also cited AI and automation for declines in office and administrative, sales and production work, but gave no percentages in its release text2, 3. The direction of the argument is the same; the 2025–35 release attaches numbers to it2, 3.
Healthcare still dominates
A new measure: AI exposure
The 2025–35 release adds AI exposure categories, a four-category classification of relative exposure to AI for every detailed occupation BLS projects2, 4. BLS says it combined five external data sources to build them2, 4. Three are theoretical measures of potential exposure. The other two estimate exposure from observed, real-world AI usage2, 4.
BLS describes the exposure categories as a new data product released alongside the 2025–35 projections2, 4. It says an exposure category is not a forecast of employment growth or decline, and that “High” or “Very high” exposure does not necessarily mean employment will decline2, 4. An occupation’s category should not be read as its projected job outcome.
What the sources do not settle
The claims we hold do not give BLS’s full methodology, the 2024–34 percentages for the fastest growing occupations2, 3, or any independent check on the projections. BLS’s own text uses “expected” and “may” for the AI and electricity links2, 3.
This article was researched and drafted with the help of AI tools, then fact-checked against its sources and edited by a human before publication. Every source is linked below. If you spot an error, please tell us and we will correct it.
Sources
- Fastest growing occupations : U.S. Bureau of Labor Statistics — bls.gov, accessed 2026-10-10
- Employment Projections: 2025-2035 Summary – 2025 A01 Results — bls.gov, accessed 2026-10-10
- Employment Projections and Occupational Outlook Handbook News Release – 2024 A01 Results — bls.gov, accessed 2026-10-10
- Artificial Intelligence (AI) exposure categories : U.S. Bureau of Labor Statistics — bls.gov, accessed 2026-10-10